
Monitoring the Docker Services

Installing, Securing and Updating Uptime Kuma
Mac Mini · Docker · Nginx Proxy Manager
Uptime Kuma provides a simple way of monitoring all the services running on my Mac Mini Docker server.
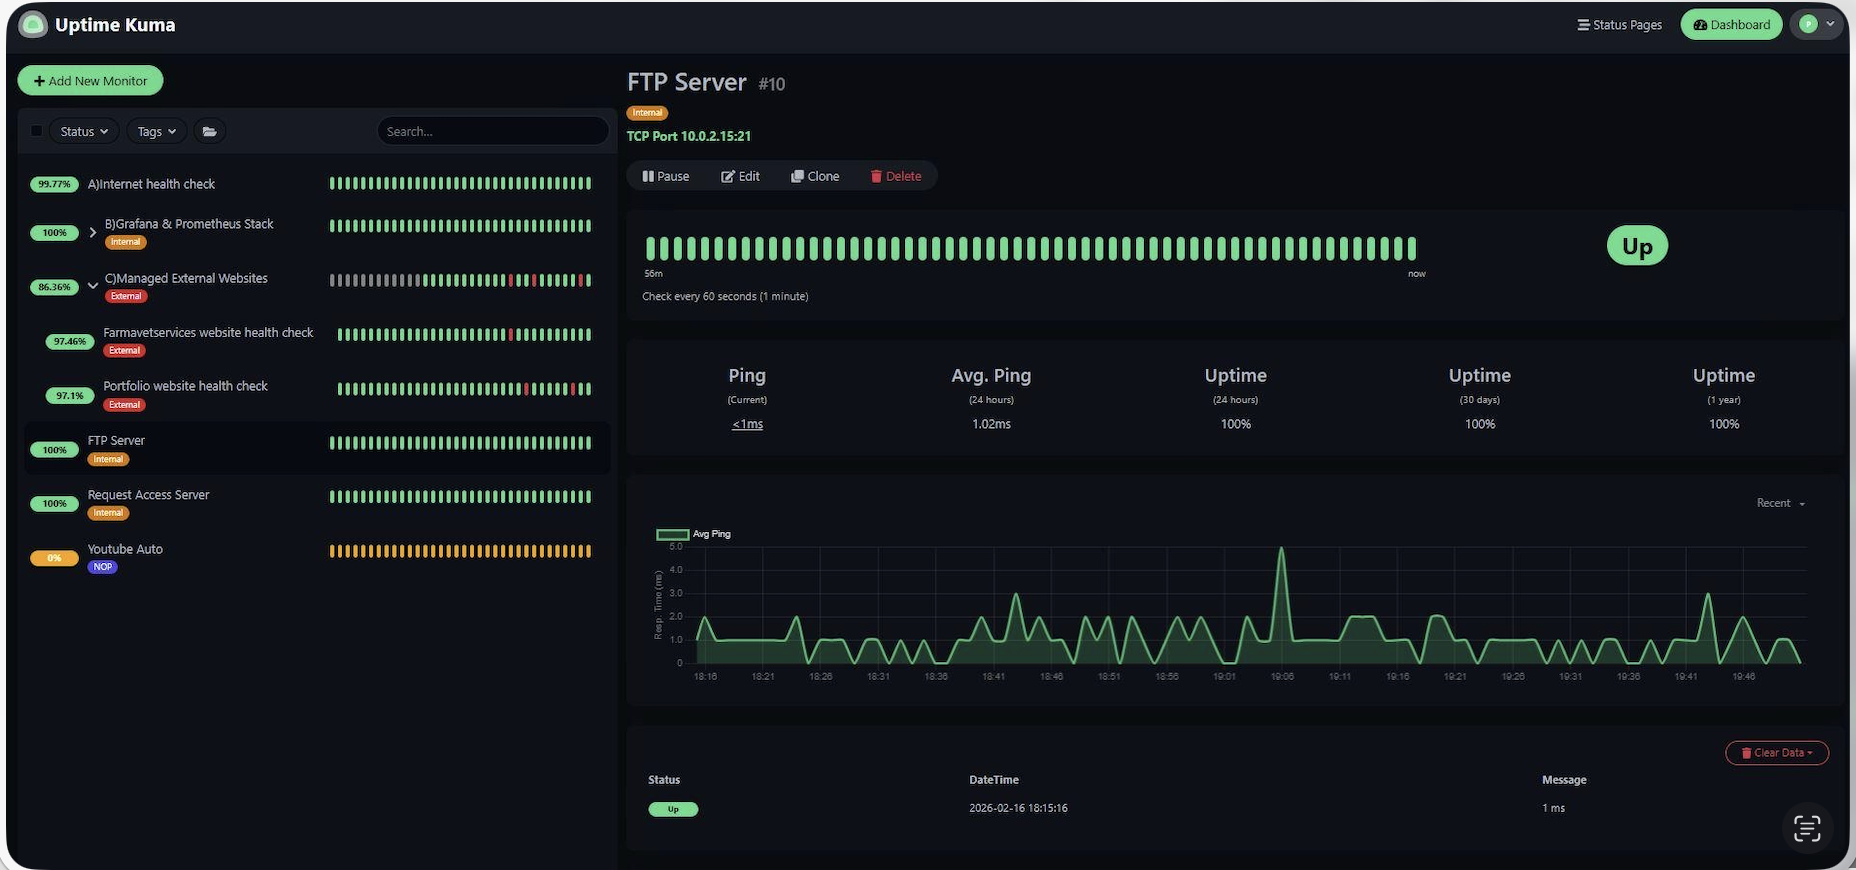
It monitors the services from inside the Docker network where possible, sends notifications through my internal Mailrelay container, and provides a dashboard showing the overall health of the Plainshawk server.
The installation uses Docker Compose, Nginx Proxy Manager and an external proxy-net network. The Uptime Kuma web interface is protected by the same home-network restriction I use for other administration services.
Architecture
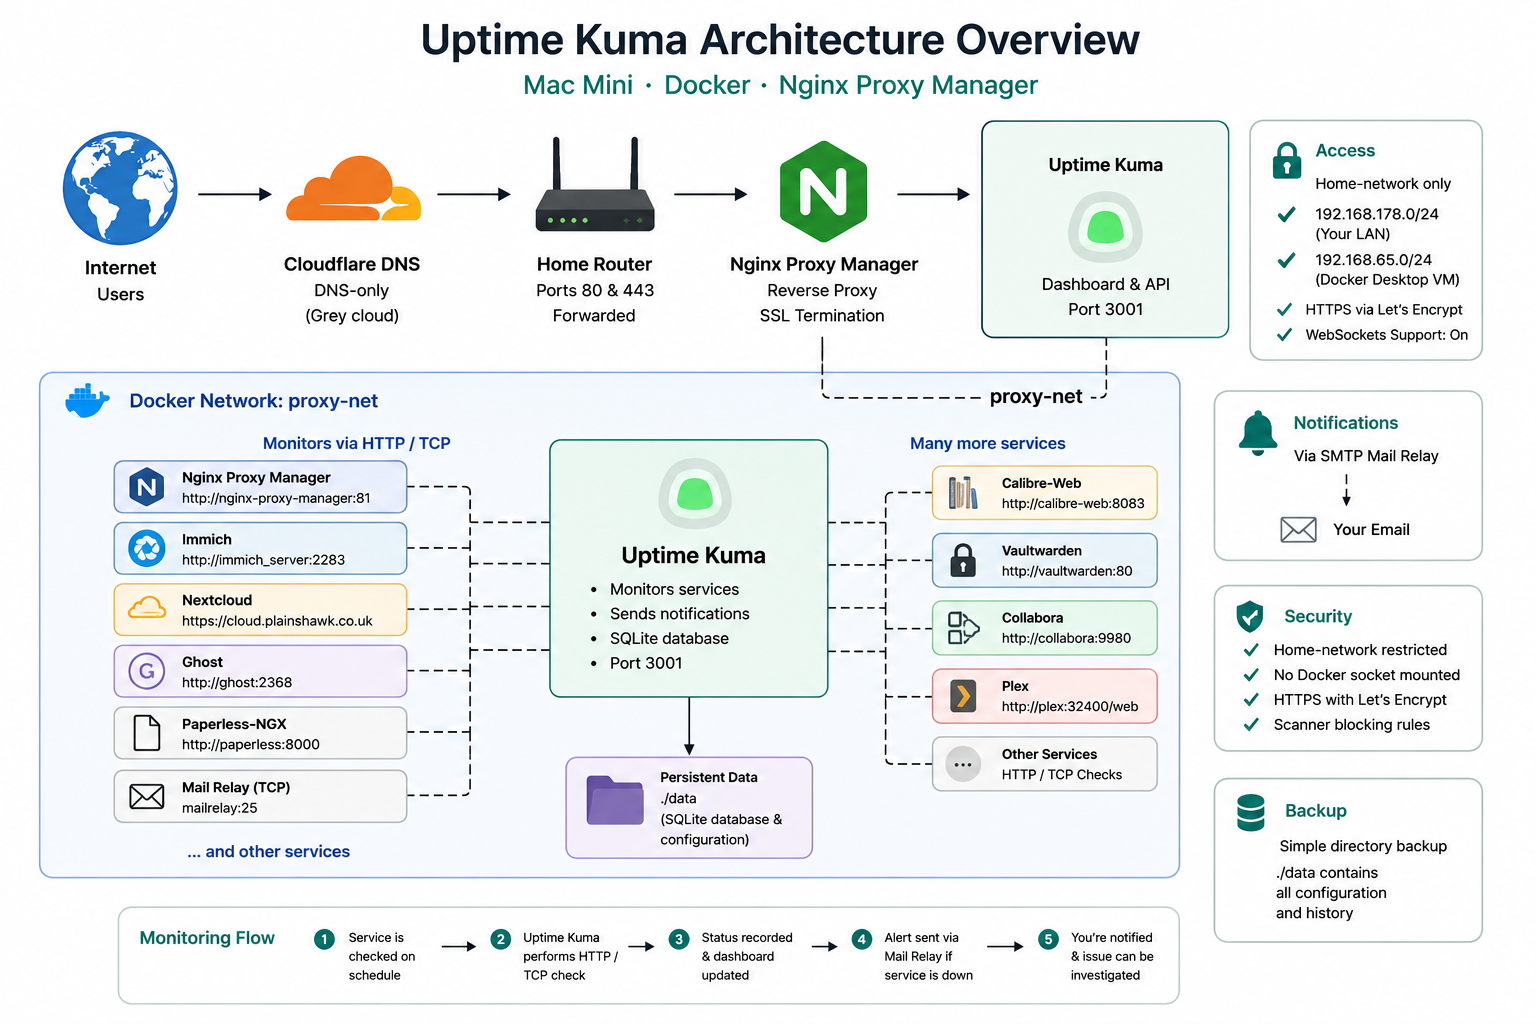
The important distinction is that Uptime Kuma does not need access to the Docker socket. It monitors services over HTTP and TCP instead.
Key lessons from this installation
There are several details here that are particularly important for this Docker Desktop installation:
- Use
louislam/uptime-kuma:2, notlatest. Thelatesttag is deprecated and still points to Uptime Kuma v1. - Enable Websockets Support in Nginx Proxy Manager. Uptime Kuma relies on WebSockets for its live dashboard.
- On macOS, include
192.168.65.0/24in the NPM allow list because Docker Desktop uses this network for its VM. - Keep Uptime Kuma on
proxy-netso it can reach the other containers by their Docker hostnames. - Don’t mount
/var/run/docker.sock. Uptime Kuma doesn’t need access to the Docker daemon for HTTP and TCP monitoring. - Store the Uptime Kuma data in
./data. This makes backing it up particularly simple. - When updating, use Docker Compose’s
up -d --force-recreaterather thandocker compose down && docker compose up -d. This is also the procedure documented by the Uptime Kuma project.
Before you start
You will need:
- Docker Desktop running
- The
proxy-netDocker network already created - Ports 80 and 443 forwarded on your router
- A Cloudflare A record for
status.plainshawk.co.uk - The Cloudflare record set to DNS only — grey cloud
Installation
Stage 1 — Create the directory structure
Create a directory for Uptime Kuma:
mkdir -p ~/docker/uptimekuma
cd ~/docker/uptimekuma
The application itself will be stored on the Mac’s internal storage, while its persistent SQLite database and configuration will live in:
~/docker/uptimekuma/dataStage 2 — Create the Compose file
Create the Docker Compose configuration:
nano docker-compose.ymlPaste:
services:
  uptime-kuma:
    image: louislam/uptime-kuma:2
    container_name: uptime-kuma
    restart: unless-stopped

    environment:
      - TZ=Europe/London

    volumes:
      - ./data:/app/data

    healthcheck:
      test: ["CMD", "curl", "-f", "http://localhost:3001"]
      interval: 30s
      timeout: 5s
      retries: 3
      start_period: 10s

    logging:
      driver: json-file
      options:
        max-size: 10m
        max-file: "3"

    networks:
      - proxy-net

networks:
  proxy-net:
external: trueThe Uptime Kuma project currently recommends the 2 tag for the latest v2 release. The latest tag is deprecated and continues to point to v1.
If you are installing a new instance, use:
louislam/uptime-kuma:2Why there is no Docker socket
You may see Uptime Kuma installations that include:
/var/run/docker.sockThis installation deliberately doesn’t.
Uptime Kuma can monitor the services using HTTP and TCP, so it doesn’t need access to the Docker daemon.
Giving a container access to the Docker socket effectively gives it very powerful control over the Docker host. There is no reason to accept that additional exposure for the monitoring configuration used here.
Connect Uptime Kuma to the network
Stage 3 — Add the DNS record
In Cloudflare, create:
Type | Name | Content | Proxy |
|---|---|---|---|
A |
| Your public IP | Grey cloud — DNS only |
This creates:
status.plainshawk.co.ukStart Uptime Kuma
Stage 4 — Start the container
Start the service:
docker compose up -dThen watch the logs:
docker compose logs -f uptime-kumaUptime Kuma normally starts within a few seconds.
Press Ctrl+C once it is running.
Then check the container:
docker compose psYou should see uptime-kuma running.
Configure Nginx Proxy Manager
Stage 5 — Add the Proxy Host
Log into Nginx Proxy Manager and go to:
Proxy Hosts → Add Proxy Host
Details
Field | Value |
|---|---|
Domain |
|
Scheme |
|
Forward Hostname |
|
Forward Port |
|
Cache Assets | Off |
Block Common Exploits | On |
Websockets Support | On |
Uptime Kuma uses WebSockets for its live interface.
If WebSockets are disabled, the dashboard may initially load but won’t update correctly in real time. The Uptime Kuma documentation specifically calls out WebSocket support when using a reverse proxy and specifically recommends enabling Websockets Support in Nginx Proxy Manager.
SSL
On the SSL tab:
- Request a new Let’s Encrypt certificate
- Force SSL: On
- HTTP/2 Support: On
Restrict the dashboard to the home network
Open the Advanced tab.
# Home network restriction
#
# 192.168.178.0/24 = your home LAN
# 192.168.65.0/24  = Docker Desktop VM gateway on macOS
# 172.16.0.0/12    = Docker internal networks

allow 192.168.178.0/24;
allow 192.168.65.0/24;
allow 172.16.0.0/12;
allow 10.0.0.0/8;
allow 127.0.0.1;
deny all;

# Block scanners — Uptime Kuma uses Node.js, not PHP

location ~ \.(php|php\d|phtml|asp|aspx|cgi)$ {
    return 444;
}

location ~ /(wp-admin|wp-login|wp-content|wp-includes|xmlrpc\.php) {
    return 444;
}

location ~ /\.(env|git|svn|aws|ssh|npmrc) {
    return 444;
}

location ~ /(phpmyadmin|pma|adminer|mysql)/ {
    return 444;
}

# Long timeouts for WebSocket connections

proxy_read_timeout 3600s;
proxy_send_timeout 3600s;
proxy_buffering off;
Save the Proxy Host.
Why 192.168.65.0/24 matters
This is one of the slightly confusing aspects of running Docker on macOS.
Docker Desktop runs containers inside its own Linux VM. Consequently, traffic arriving at Nginx Proxy Manager from applications running on the Mac can appear to originate from the Docker Desktop network rather than your normal home LAN.
For this installation, the relevant network is:
192.168.65.0/24Without that rule, you can find yourself locked out of Uptime Kuma even though you are sitting on the home network.
If you get a 403 from your own network
Check the Nginx Proxy Manager error log.
A safer way to run the command with the wildcard expanded inside the container is:
docker exec nginx-proxy-manager \
  sh -c 'tail -n 20 /data/logs/proxy-host-*_error.log'
Look for the source IP of the rejected request.
It should fall into one of the allowed ranges:
192.168.178.0/24
192.168.65.0/24
172.16.0.0/12
10.0.0.0/8
127.0.0.1
If your home network uses a different subnet, change the first rule accordingly.
Create the administrator account
Stage 6 — Create your admin account
Navigate to:
https://status.plainshawk.co.uk
The initial setup will ask you to create an account.
Do this immediately.
The first account becomes the administrator and registration is then closed automatically.
Use a strong, unique password and store it in Vaultwarden rather than relying on your memory or a local text file.
Configure email notifications
Stage 7 — Configure the Mailrelay
Uptime Kuma can send notifications through the Mailrelay container already running on the Docker network.
Go to:
Settings → Notifications → Add Notification
Field | Value |
|---|---|
Notification Type | SMTP |
Name | Mail Relay |
Hostname |
|
Port |
|
Security | None / Off |
Ignore TLS Error | On |
From |
|
To | Your email address(es) |
Click Test.
You should receive a test email.
If the test succeeds, click Save.
Add your monitors
Stage 8 — Monitor the Plainshawk services
This is where Uptime Kuma becomes particularly useful.
Click Add New Monitor for each service.
Where possible, use the internal Docker hostname rather than the public HTTPS URL.
This has several advantages:
- The monitor doesn’t depend on Nginx Proxy Manager.
- It doesn’t depend on external DNS.
- It doesn’t depend on Let’s Encrypt.
- It tests whether the actual service is running.
- It avoids sending local monitoring traffic out through the router and back into the network.
Name | Type | URL / Host | Port |
|---|---|---|---|
Nginx Proxy Manager | HTTP |
| — |
Immich | HTTP |
| — |
Nextcloud | HTTP |
| — |
Collabora | HTTP |
| — |
Ghost | HTTP |
| — |
Homebox | HTTP |
| — |
Vaultwarden | HTTP |
| — |
Immich Kiosk | HTTP |
| — |
Lychee | HTTP |
| — |
Calibre | HTTP |
| — |
Calibre-Web | HTTP |
| — |
BirdNET-Go | HTTP |
| — |
Paperless-NGX | HTTP |
| — |
Mail Relay | TCP Port |
|
|
Plex | HTTP |
| — |
The exact Docker hostname must match the name of the container or Docker Compose service on the network.
For example:
http://paperless:8000works because the Paperless container is named paperless.
If a monitor reports a service as down, check the actual Docker container/service name before changing anything else.
Recommended monitor settings
For each monitor:
Setting | Value |
|---|---|
Heartbeat Interval | 60 seconds |
Retries | 3 |
Retry Interval | 20 seconds |
Notification | Mail Relay |
This gives a reasonable balance between prompt notification and avoiding false alarms caused by a service taking a few seconds to restart.
Create a status page
Stage 9 — Create the Plainshawk status page
Uptime Kuma can create a status page containing selected monitors.
Go to:
Status Pages → New Status Page
Configure:
Setting | Value |
|---|---|
Name | Plainshawk Services |
Slug |
|
Monitors | Add the services you want to display |
The resulting page is:
https://status.plainshawk.co.uk/status/homeImportant: public versus private access
There is a security issue with the original configuration worth pointing out.
The Nginx Proxy Manager configuration above contains:
deny all;Therefore the entire hostname, including:
/status/homeis restricted to the home network.
It cannot simultaneously be a public status page accessible to someone outside your home.
Private status page — recommended for this installation
Keep the current NPM access restriction. Your partner can access the status page while connected to your home network.
Public status page
If you want friends or your partner to be able to see service status while away from home, create a separate public-facing status hostname and Proxy Host without the home-network ACL.
For example:
status-public.plainshawk.co.ukI would keep the administrative Uptime Kuma interface itself protected and expose only the status page if you decide that external access is genuinely useful.
Automatic startup
Stage 10 — Add Uptime Kuma to the startup script
Open your startup script:
nano ~/docker/start-all.shConfirm that Uptime Kuma starts before Nginx Proxy Manager:
echo "Starting Uptime Kuma..."
cd /Users/gavin/docker/uptimekuma && docker compose up -d
The important point is that Uptime Kuma should be connected to proxy-net before Nginx Proxy Manager attempts to proxy traffic to it.
Backups
Stage 11 — Back up Uptime Kuma
Uptime Kuma stores its configuration, monitors, notification settings and other data in its SQLite database under:
./dataBecause this is a bind mount, backing up the application is straightforward.
Open the nightly backup script:
nano ~/docker/backups/backup.shAdd:
# Uptime Kuma
cp -r ~/docker/uptimekuma/data \
  $BACKUP_DIR/uptimekuma_$DATE

echo "Uptime Kuma backup done"Unlike applications where the database is stored in a separate container, Uptime Kuma’s persistent data is contained in:
~/docker/uptimekuma/dataA directory backup therefore captures the important application data.
The Uptime Kuma documentation also warns that the /app/data filesystem must support the file locking required by SQLite, which is another reason to keep this on a normal local filesystem rather than NFS.
Updating Uptime Kuma
Stage 12 — Update the container
There is an important distinction between restarting a container and updating it.
docker compose restart restarts the existing container. It does not recreate the container from a newly pulled image.
For an actual image update, the Uptime Kuma project recommends:
docker compose pull
docker compose up -d --force-recreate
For this installation, I would use the following procedure.
1. Back up the data
cd ~/docker/uptimekuma

cp -r ./data \
  ~/docker/backups/uptimekuma_preupdate_$(date +%Y%m%d_%H%M%S)
2. Pull the new image
docker compose pull3. Recreate the container
docker compose up -d --force-recreate4. Watch the logs
docker compose logs -f uptime-kumaWait for Uptime Kuma to start normally.
5. Verify the version
docker exec uptime-kuma \
cat /app/package.json | grep '"version"'docker compose down && docker compose up?There is no need to take the entire stack down.
docker compose up -d --force-recreate recreates the Uptime Kuma container using the newly pulled image while leaving the external proxy-net network itself intact.
This is also the update procedure recommended by the Uptime Kuma project.
Quick reference
URL | Purpose |
|---|---|
| Uptime Kuma dashboard |
| Plainshawk status page |
Troubleshooting
403 from inside your home network
The most likely cause is that Nginx Proxy Manager is seeing your request as originating from an address that isn’t in the allow list.
Check the NPM error log:
docker exec nginx-proxy-manager \
  sh -c 'tail -n 20 /data/logs/proxy-host-*_error.log'
If you see an address such as:
192.168.65.1make sure this network is allowed:
allow 192.168.65.0/24;Dashboard loads but doesn’t update
WebSockets aren’t working.
Check the Nginx Proxy Manager Proxy Host:
Details → Websockets Support → On
Uptime Kuma’s reverse-proxy documentation specifically identifies WebSocket support as necessary.
A monitor says DOWN but the service is working
First check the monitor URL.
If you’re monitoring a Docker service, prefer:
http://container-name:portover:
https://public-domain.exampleThe internal address removes Nginx Proxy Manager, DNS and Let’s Encrypt from the monitoring path.
For example:
http://paperless:8000is generally a better test of whether Paperless itself is running than:
https://docs.plainshawk.co.ukA monitor using an internal hostname doesn’t work
Check that both containers are connected to the same Docker network.
For example:
docker network inspect proxy-netLook for both:
uptime-kumaand the container you are trying to monitor.
If the target container isn’t on proxy-net, either connect it to the network or use another appropriate monitoring path.
Can’t reach Uptime Kuma after an NPM change
Check that the Uptime Kuma container is connected to proxy-net:
docker network inspect proxy-netIf necessary, reconnect it:
docker network connect proxy-net uptime-kumaThen restart Uptime Kuma:
docker compose restartEmails aren’t being sent
First test whether Uptime Kuma can reach Mailrelay:
docker exec uptime-kuma \
  curl -s telnet://mailrelay:25
If the connection is refused, check that the Mailrelay container is connected to proxy-net.
You can inspect the network with:
docker network inspect proxy-netLook for:
mailrelayand:
uptime-kumaSecurity checklist
- Use
louislam/uptime-kuma:2 - Don’t use the deprecated
latesttag - Don’t mount
/var/run/docker.sock - Keep Uptime Kuma on
proxy-net - Use HTTPS through Nginx Proxy Manager
- Enable WebSockets Support
- Restrict the dashboard to the home network
- Allow
192.168.65.0/24for Docker Desktop on macOS - Use a strong administrator password
- Store the password in Vaultwarden
- Configure Mailrelay notifications
- Back up the
datadirectory - Add Uptime Kuma to the startup script
- Monitor the important Docker services
- Test the notification system
- Back up before updating
Conclusion
Uptime Kuma is now integrated into the Plainshawk Docker environment rather than simply running as an isolated monitoring application.
It sits behind Nginx Proxy Manager for secure HTTPS access, uses the internal Docker network to monitor services directly, sends alerts through the existing Mailrelay container and keeps its configuration in a simple directory that can be backed up alongside the rest of the server.
The result is a useful distinction between “the web site is accessible” and “the underlying service is actually healthy”.
And because Uptime Kuma itself is monitored and starts automatically with the rest of the Docker environment, it provides a useful safety net for the whole Plainshawk server.